
One EduProtocol I haven’t used much in the last few years is the Number Mania. I try to use this protocol 5-6 times a school year. It’s a great way to introduce students to a topic for any subject. I especially like to use this when a topic involves a lot of numbers – battles, wars, revolutions, etc. The protocol itself is fairly simple and can be completed in 1, 50 minute class period:
- Students read one source or research through multiple sources for 10-15 minutes.
- They submit numbers and facts through a Google Form.
- I transfer the Google Form data into a Google Sheet and share it.
- Students create an infographic (Here is a great template from Stephanie Howell) about a given topic from the crowdsourced information from the Google Sheet.
In this post, I’m reflecting on my current use of Number Mania and the different ways I need to consider it for future use.
Number Mania – 1st Rep
This school year I have used Number Mania 3 times. The first time was a non-academic way to introduce the protocol. I asked students to make an infographic about themselves. It’s a great way to get to know students at the beginning of the year. Students shared 5-6 numbers and facts about themselves. I use this “get to know you” Number Mania introduction to teach these ideas:
- Creating Word Art – changing fonts, colors, etc.
- Adding Textboxes.
- Using Ctrl+D to duplicate shapes and Word Art.
- Organizing information.
- Adding titles to infographics.
Once students know these basics, they are ready to create some amazing infographics. The idea of the first rep is to teach the process along with some basics so students can focus on content in the future.
Number Mania – 2nd and 3rd Rep
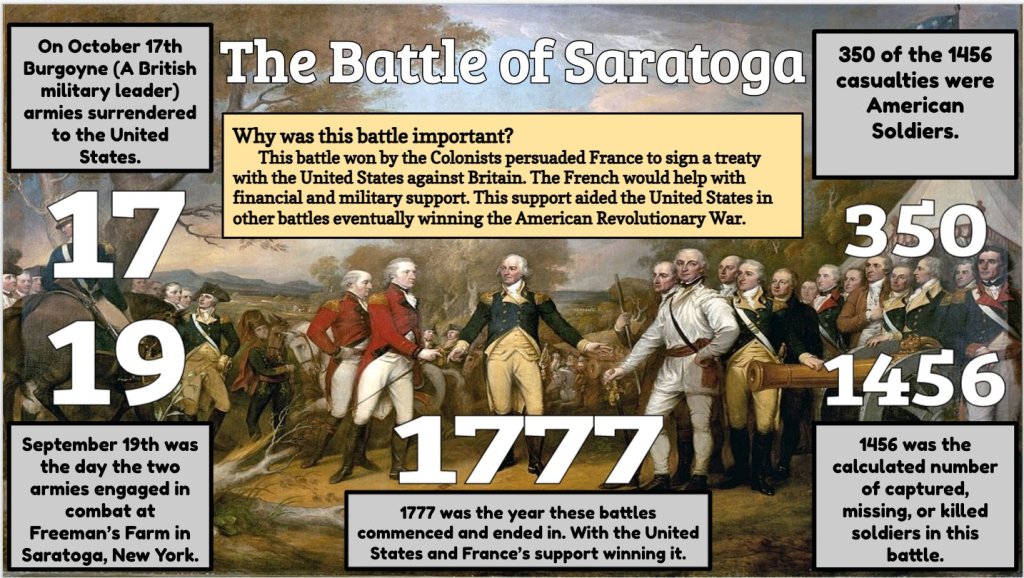
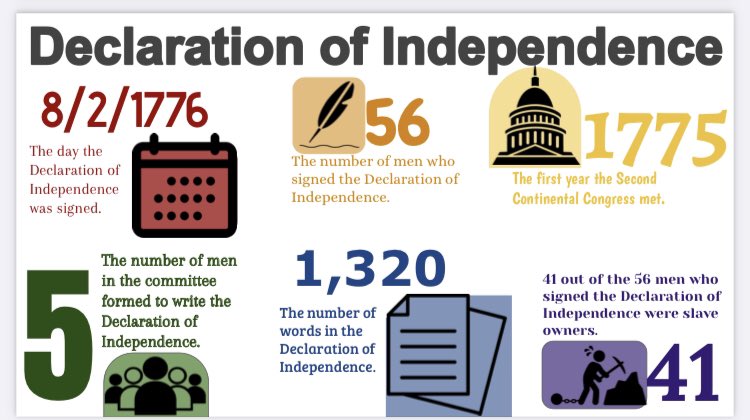
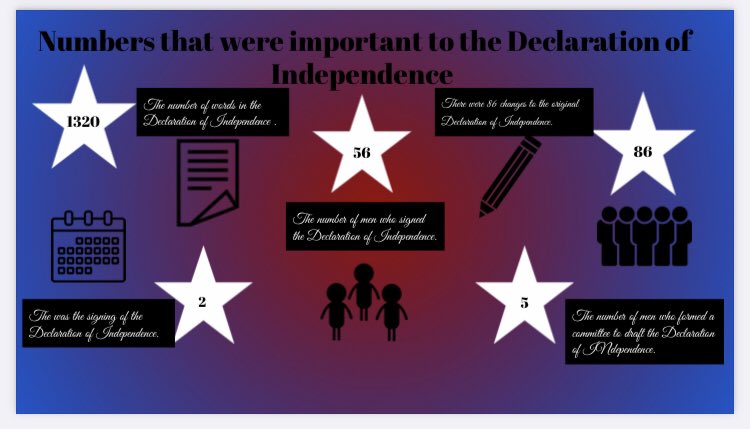
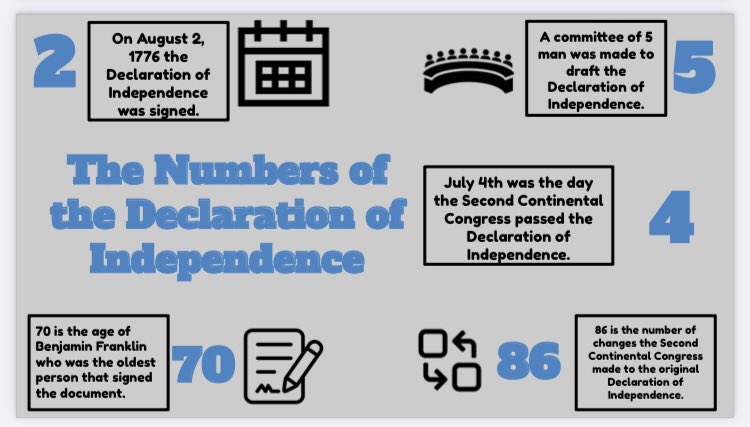
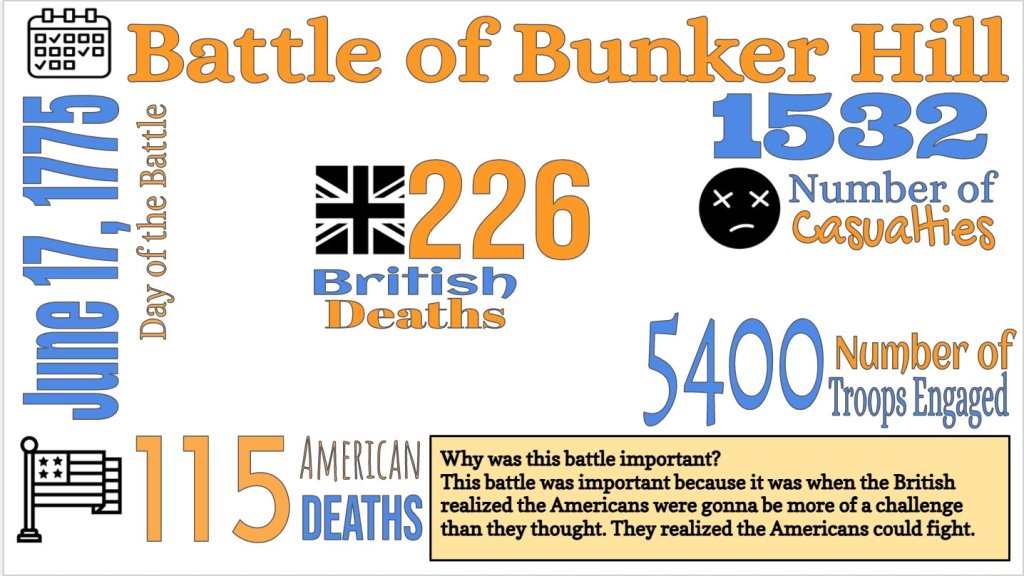
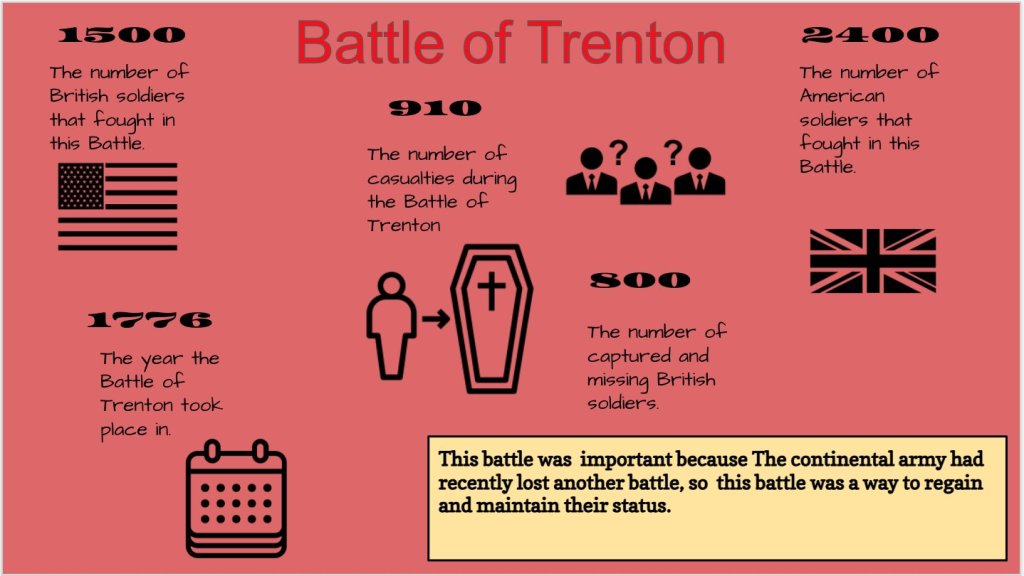
For my 2nd and 3rd reps of Number Mania, I used for introducing the Declaration of Independence and covering a battle from the American Revolution. In past years, I had students complete Number Mania’s on both topics, but I had them research through Google searches. For a high school class, this would be good and create discussions of finding reliable sources. However, for Middle School, it was too open-ended and unstructured.
This year I wanted to focus on providing one source for students to create infographics. For the Declaration of Independence, I couldn’t find a source, so I typed this one. For the American Revolutionary War battles, I used this great source from American Battlefield Trust. Using these sources made the reading and number finding more structured.
After the 10-15 minute reading and number finding, I establish the success criteria for the infographic:
- The infographic has a title.
- The infographic has 5 or more numbers with facts.
- The infographic is organized and easy to read.
- The infographic is creative.
As a result of using more structure with one source and success criteria, my results have been A LOT better among my middle school students.


Reflection
To the outside world, these infographics look awesome! My students did a fantastic job and I’m thoroughly impressed. However, I can’t help but think how I can get better at building off of this protocol. Based on Quizizz scores, I know these students learned something from these lessons. But, I want to design these lessons differently. Here are some ideas running through my mind:
- Design an infographic with nubers and facts that CREATE a story about a historical event. Tell that story through a Flipgrid or blog writing.
- I need to be better with having students share and tell each other about their learning.
- Pair with a Thin Slide at the end of class – 4 minutes to design a slide and 10 seconds to explain your biggest takeaway from the information.
- Use this as an entry point into a Cyber Sandwich. Have students take numbers away from a reading. Then use the Cyber Sandwich to take more information and main ideas away from the same reading.
- Pair with a Ted Ed Video – 8pARTS template designed by Amanda Sandoval.
